S&P Fake Bounce Nailed! Oil Is the Match, Rates Are the Bomb: Three FOMC Scenarios That Could Break the Market
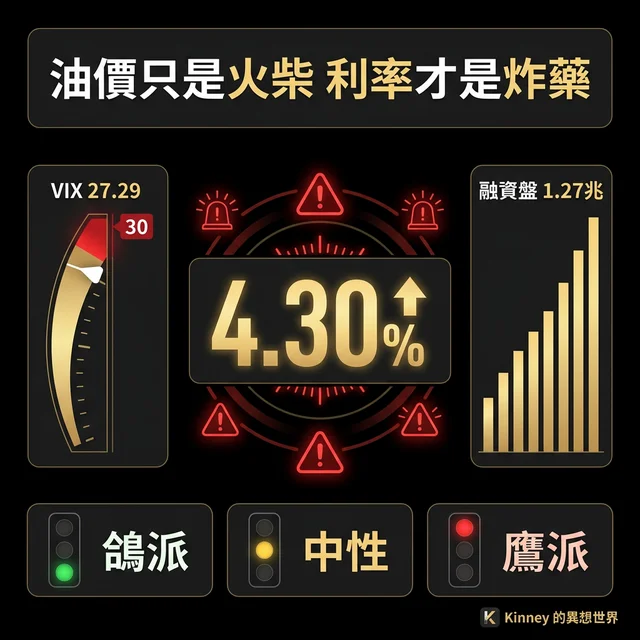
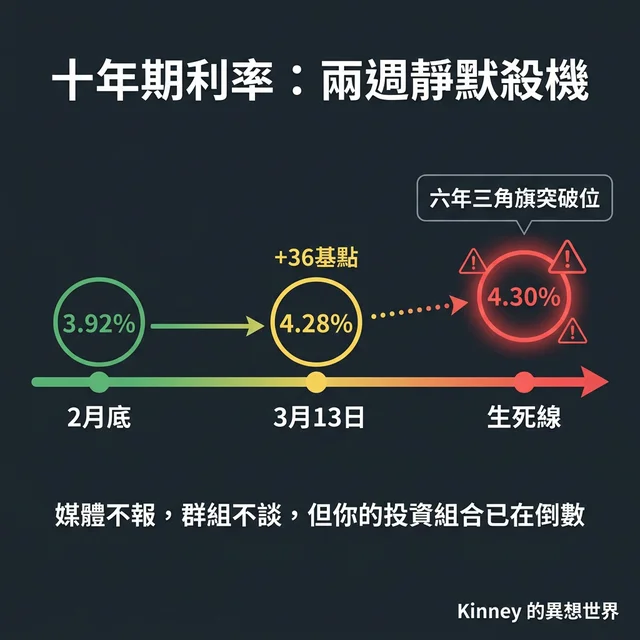
The 10-year Treasury yield climbed from 3.92% to 4.28% in two weeks. 4.30% is the breakout level of a six-year ascending triangle. Tech stocks at 37x forward P/E, margin debt at a record $1.27 trillion. Next Wednesday's FOMC dot plot is judgment day.
The Prediction Landed, but the Story Has Just Begun
On Monday I said SPY's bounce to 678 was most likely a trap — don't chase. Today SPY closed at 663. Open your phone and it's wall-to-wall Middle East war reports and oil price charts.
Let's shift our gaze to the U.S. stock market.
Those missiles' flight paths are very far from our brokerage accounts. But there is one number that is only 0.01cm away. Over the past two weeks, the 10-year Treasury yield quietly crawled from 3.92% to 4.28% — a 36 basis point move. No headlines. No group chat discussions. If oil is the match, then interest rates are the bomb buried inside your portfolio.
A Chain of Dominoes, Four Days of False Security
The Strait of Hormuz is shut, affecting 20% of global oil shipments. The International Energy Agency (IEA) coordinated 32 nations to release 400 million barrels of strategic reserves. Sounds like a lot? The world burns roughly 100 million barrels a day. 400 million buys you four days. America's own Strategic Petroleum Reserve (SPR) has 415 million barrels left — only 58% of capacity — and was already tapped during the 2022 Russia-Ukraine war. Releasing reserves only temporarily caps prices without solving the root problem (supply is physically cut). During the 2011 Libya crisis and early 2022, SPR releases suppressed oil prices for an average of 30 days before the effect completely faded.
Oil is locked above $100. Inflation expectations are warming. The bond market isn't waiting for the Fed to speak — it's already repricing.
The result: those 36 basis points. Two weeks. Dead quiet.
4.30%: An Invisible Line Between Life and Death
The kill power of interest rates should not be underestimated. From 3% to 4%, the stock market can tolerate it. But from 4.25% to 4.30%, the game changes entirely.
Seeking Alpha and Danish investment bank Saxo Bank both flag 4.30% as a key resistance level. Morgan Stanley's 2026 forecast range tops out at 4.25% — already broken. Worth noting is a widely-circulated long-term chart on TradingView: the 10-year yield is testing the upper edge of a six-year ascending pennant. A clean break above 4.5% would mean rates entering a long-term upward trajectory — "higher for longer" stops being a slogan and becomes reality.
Wall Street's valuation models discount future cash flows using interest rates. At 3.9%, the market could pretend two rate cuts were coming this year. At 4.30%, that expectation is essentially dead. High-multiple, no-earnings stocks will see their valuation models repriced — and their share prices will crater.
The Meat Grinder: 37x P/E Meets $1.27 Trillion in Leverage
The U.S. stock market is experiencing historic-grade overvaluation colliding with historic-grade leverage.
On valuations: the S&P 500 tech sector's forward P/E stands at 37.43x, versus a five-year average of 27–35x — pressing against the ceiling. The Buffett Indicator (total market cap to GDP) reads 221%, extreme overvaluation territory. The Shiller P/E is approaching 39, having touched 40.58 in early January — second only to the 2000 dot-com bubble.
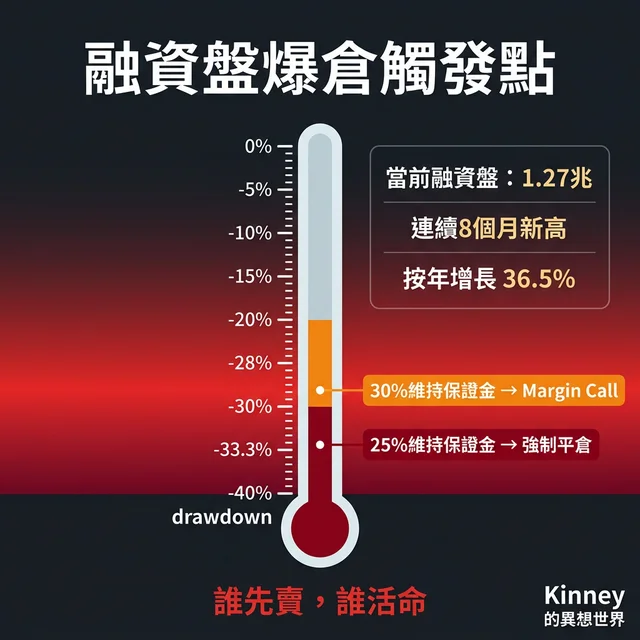
On leverage: U.S. margin debt stands at $1.279 trillion, eight consecutive months of all-time highs, up 36.5% year-over-year.
CNN Fear & Greed Index: 21 — "Extreme Fear." AAII bearish sentiment: 46.4%. Everyone sounds scared, but the margin positions haven't shrunk. Mouths say fear; bodies say greed. No one is willing to de-leverage first.
A movie theater on fire. Everyone smells smoke, but everyone thinks they can reach the exit first.
The real margin calls haven't even started. Under Reg T rules, at 25% maintenance margin, a 33.3% drawdown from highs triggers a Margin Call. At 30% maintenance, you only need a 28.5% drawdown. $1.27 trillion in margin debt is approaching the tipping point. Whoever sells first, lives.
2022's Falling Knife Is Back
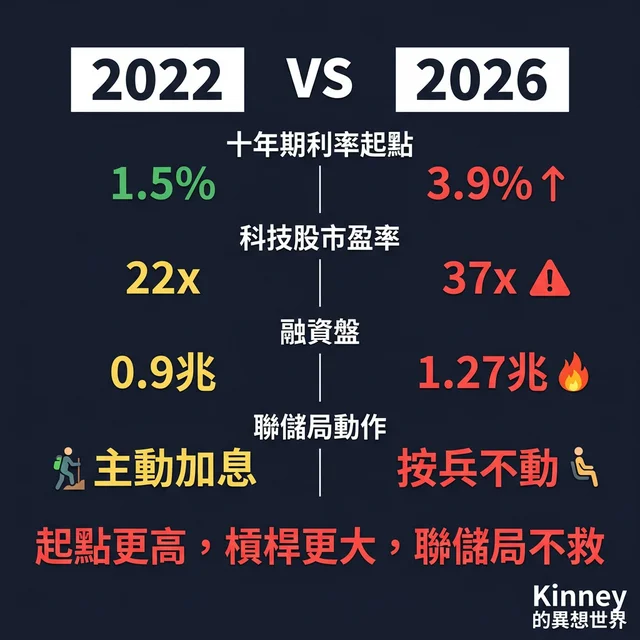
In 2022, the 10-year yield surged from 1.5% to 4.2% — a 270 basis point climb. The S&P 500 fell 19.4%, with a maximum drawdown of 27%. The Nasdaq lost a third of its value. ARK Invest founder Cathie Wood's ARKK evaporated 67% — from "Ark Queen" to retail investors' most expensive lesson. Tesla, Meta, PayPal all halved or worse. You recognize those names because some of them are probably sitting in your account right now.
In 2022, the S&P fell 19% while earnings expectations barely changed — only a 1.2% downward revision. The decline was almost entirely multiple compression. Companies weren't unprofitable; the 10-year yield went from 1.5% to 4%, and investors simply refused to pay 22x earnings anymore. P/E collapsed from 22x to 15x.
Now the same knife is back.
But this isn't a 2022 rerun. In 2022, the Fed was actively hiking. This time the Fed is sitting still. Same outcome, different mechanism. Oil pushes up inflation expectations, the bond market prices it in, and rates surge anyway. The Fed doesn't move; the market moves for it. And this time the starting point is more dangerous: 2022 started with rates at 1.5% and tech P/E around 22x. Today rates start at 3.9%, tech P/E is 37x, and margin debt is 1.4x what it was in 2022.
San Francisco Fed research shows that post-2022, the transmission sensitivity of oil prices to interest rates is more than three times the pre-pandemic level. For every 3% rise in oil, the 2-year yield jumps 4.5 basis points. Before the war, that number was virtually zero. Inflation expectations have lost their anchor — any supply chain shock gets amplified by the bond market.
The Most Hopeless News: The Fed Won't Save You
By this point, you might be waiting for me to say "the Fed will step in."
It won't.
Interbank lending costs: normal. Treasury General Account cash balance: normal. Fed balance sheet: normal. All three liquidity pipelines are functioning.
BofA strategist Michael Hartnett says it feels like 2008. He got the direction right but misidentified the nature. 2008 was a burst pipe — the Fed could fix the plumbing. In 2026, the pipes are intact. That's what makes it hopeless. No broken plumbing means no one is coming to rescue you. The Fed has no reason to cut early, and restarting quantitative easing is out of the question. No QE life raft. This isn't a systemic crisis — it's a ruthless culling of "extreme valuation plus extreme leverage." You swim on your own.
Judgment Day: FOMC March 18
Tuesday (3/17) and Wednesday (3/18) is the Federal Open Market Committee (FOMC) meeting. Rate decision at 2:00 PM ET Wednesday, followed by Chair Jerome Powell's press conference at 2:30 PM.
Markets expect no rate change. CME FedWatch shows over 99% probability of holding at 3.50–3.75%.
The real signal is the dot plot. Don't listen to what Powell says — his words are always deliberately ambiguous, that's his job. Just read the dots.
Three scenarios.
Dovish: Dot plot maintains expectations for two rate cuts by end of 2026. Yields retreat to 4.15%–4.20%, stocks get a brief relief rally. But a rally doesn't mean a bottom — Monday's bounce already proved that. Neutral: Rate cut expectations reduced from two to one. Yields chop between 4.25%–4.30%. Stocks grind sideways — neither crash nor bounce. The most torturous scenario. Hawkish: The 2026 year-end rate median shifts up from 3.4% to 3.5% or even 3.75% — the Fed officially stamps "higher for longer." Yields punch through 4.30%, six-year pennant breakout confirmed. Tech valuation stampede begins, $1.27 trillion in margin debt detonates in sequence.Hawkish surprises aren't rare. June 2021, March 2022, September 2022, June 2023, September 2023 — the Fed slapped the market's face on the dot plot five times. Each time: yields spiked, stocks took heavy losses within a week.
Before Next Wednesday, Watch Three Numbers
10-year yield at 4.30%. If it holds above this line on Wednesday, the six-year pennant breakout is confirmed and every "tech has bottomed" dip-buying thesis can be deleted.
VIX above 30 means the market enters high-panic territory. Currently at 27.29. Above 30, the $1.27 trillion margin debt pile faces forced liquidation thresholds. Indiscriminate selling after 2:30 PM means institutions are clearing positions — do not catch the falling knife.
March 18 FOMC dot plot. Look directly at the 2026 year-end rate median. If rate cut expectations are wiped out, the Fed has officially stamped "higher for longer." After that day, cash is king — not because it's conservative, but because it's survival.
常見問題 FAQ
Why are 10-year Treasury yields more important than oil prices?
Oil affects the cost side, but interest rates directly impact the valuation of all assets. Wall Street's discounted cash flow (DCF) models use rates as the denominator. A move in the 10-year yield from 3.9% to 4.30% effectively discounts future earnings by roughly 8%. At the S&P 500 tech sector's 37x forward P/E, this implies valuation compression could vaporize over $300 billion in market cap.
What's the trigger point for the $1.27 trillion margin debt blowup?
Under FINRA's Reg T rules and a typical 25% broker maintenance margin requirement, a 33.3% drawdown from portfolio highs triggers a margin call. With stricter 30% maintenance, only a 28.5% drop is needed. As of March 2026, U.S. margin debt stands at $1.279 trillion, up 36.5% year-over-year, setting record highs for eight consecutive months.
How should I read the FOMC dot plot — what's the key signal?
Look directly at the median 2026 year-end federal funds rate projection. If it shifts up from December's 3.4% to 3.5% or higher, it means rate cut expectations are being trimmed. The market currently prices two cuts in 2026; if the dots show one or zero, the 10-year yield could break through the 4.30% resistance level of a six-year ascending pennant pattern. --- _(Data sources: CME FedWatch, FINRA Margin Statistics, CNN Fear & Greed Index, AAII Sentiment Survey, TradingView, San Francisco Fed Economic Letter, IEA. Corrections welcome if any data errors are found.)_ _—Kinney's Wonderland_