SpaceX's First Earnings Report Faces Two Tests: A $1.5 Trillion Valuation and 911.5 Million Shares of Potential Selling Pressure
SpaceX's first earnings report as a public company faces a $1.5 trillion valuation and 911.5 million shares eligible for sale. This analysis tests Starlink's profitability, Q2 cash flow, fair value and the market's ability to absorb post-lock-up supply.
Research cut-off: After the US market close on 3 August 2026 (ET)
Format: Pre-earnings analysis
SpaceX will report its first results as a public company after today's market close. Two days later, up to 911.5 million shares will become eligible for sale. At the 3 August closing price of $114.53, the company has a market capitalisation of about $1.51 trillion. The report must show that SpaceX is still growing, that growth can turn into cash, and that demand is strong enough to absorb the potential lock-up selling pressure.
My view is that this report cannot clear both hurdles. Starlink is already profitable, and I expect it to remain profitable in the second quarter. AI, Starship and infrastructure will continue to consume large amounts of capital. Even a strong report can only prove that SpaceX is still growing. It cannot prove that today's share price is reasonable or that the market can absorb the potential supply.
1. Starlink Is Profitable; AI and Space Remain Loss-Making
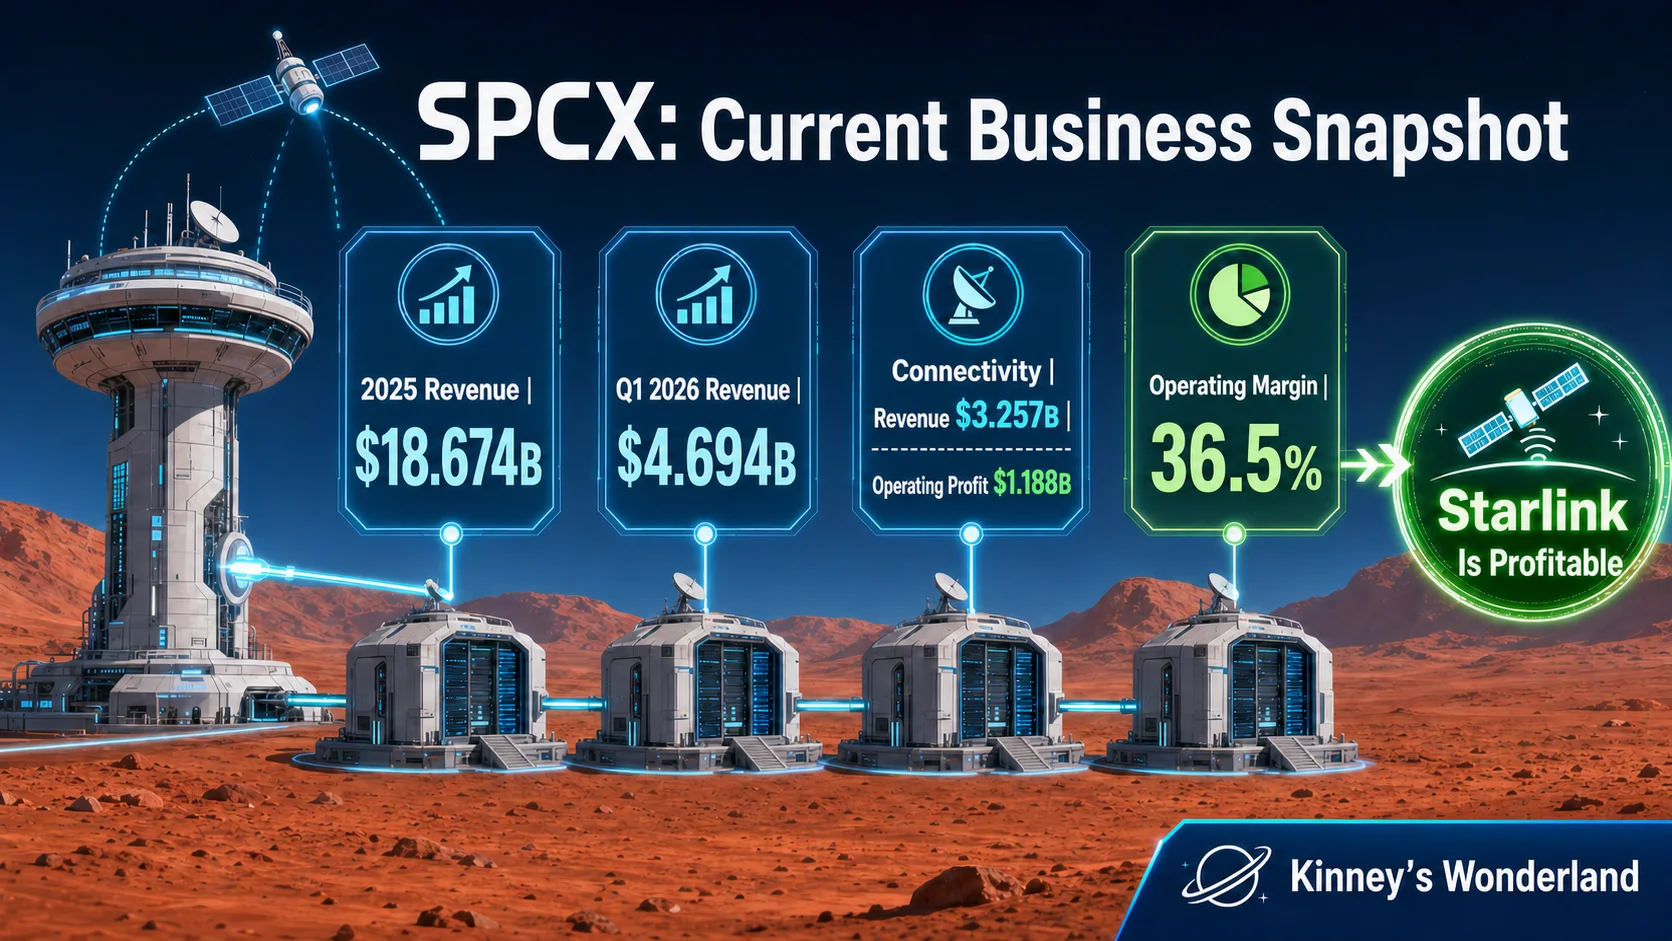
SpaceX generated $18.674 billion of revenue in 2025 and $4.694 billion in the first quarter of 2026. Connectivity produced $3.257 billion of first-quarter revenue and $1.188 billion of operating profit, for a margin of about 36.5%. Starlink has already shown that scale can turn into profit.
The problem lies in the rest of the business. The Space segment generated $619 million of revenue and an operating loss of $662 million. AI produced $818 million of revenue but lost $2.469 billion at the operating level. The AI loss alone was more than twice Connectivity's operating profit. If losses widen while investment spending accelerates, higher revenue only means a larger business. It does not improve returns for shareholders.
2. My Q2 Forecast: $6.8 Billion of Revenue and Negative $11 Billion of Free Cash Flow
The current market expectation is for second-quarter revenue of about $6.9 billion and a Connectivity operating margin of roughly 35.9%.
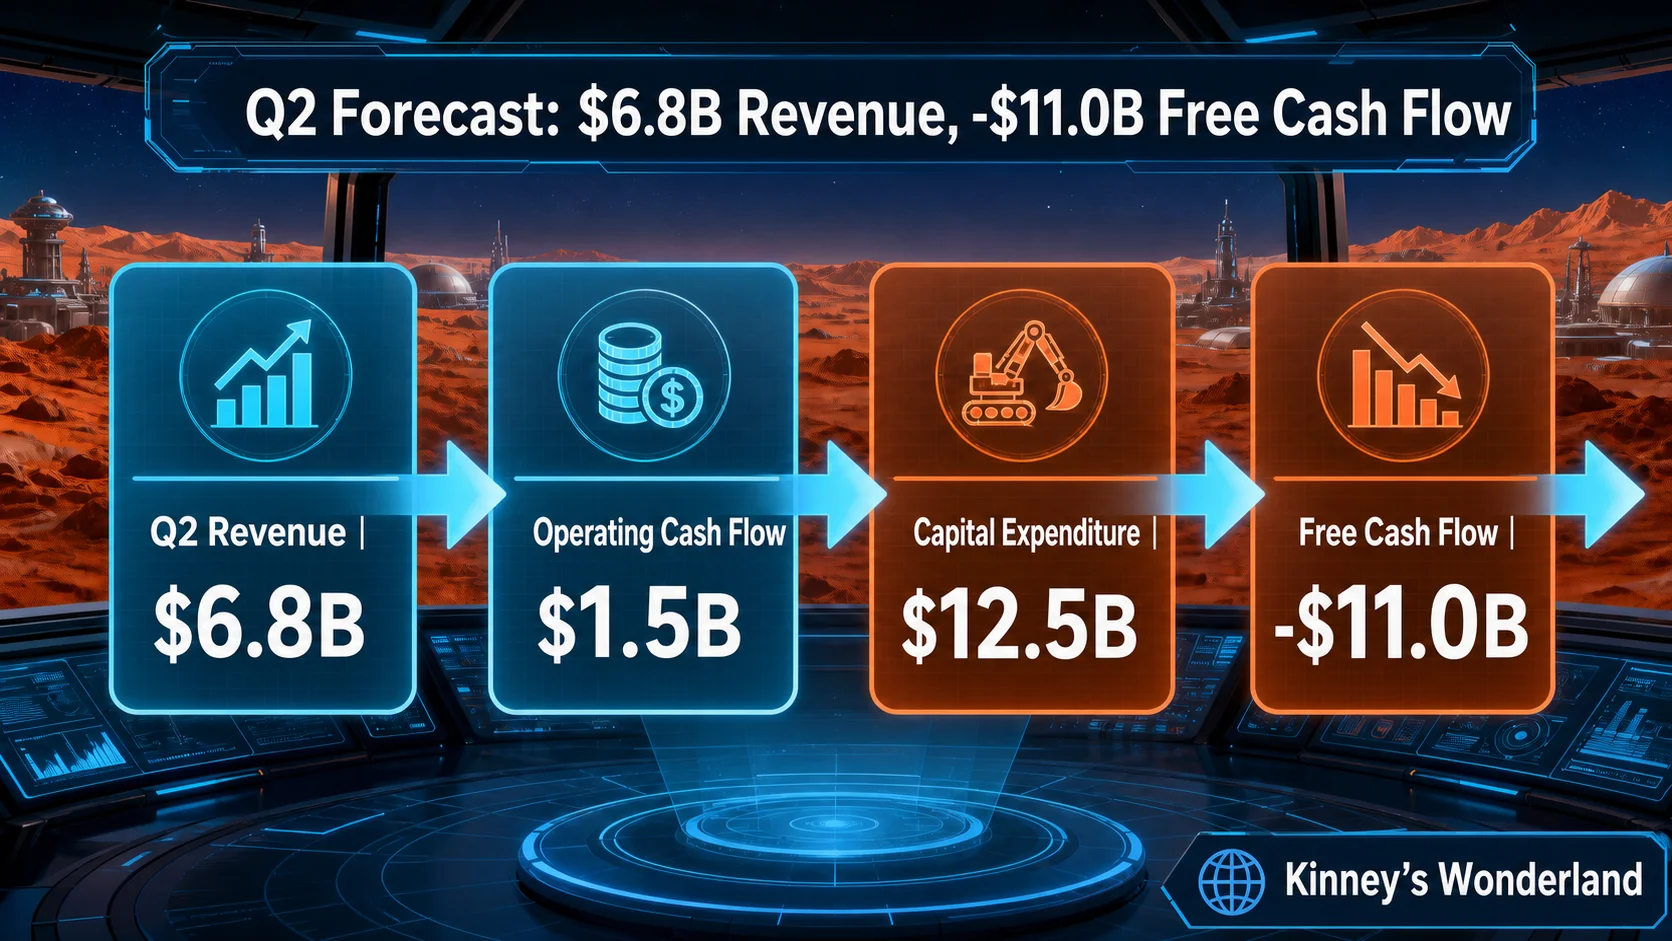
I start with first-quarter segment revenue and assume sequential growth of 32% for Connectivity, 83% for AI and 62% for Space. That produces a second-quarter revenue forecast of $6.8 billion: about $4.3 billion from Connectivity, $1.5 billion from AI and $1.0 billion from Space. These segment growth rates are my scenario assumptions.
At a Connectivity operating margin of about 35.9%, the segment would generate approximately $1.54 billion of operating profit. If the combined losses from Space and AI remain near the first-quarter level of $3.1 billion, the group would record an operating loss of about $1.5 billion. Applying Connectivity's first-quarter EBITDA margin of roughly 64% to $4.3 billion of revenue, while holding other segment and corporate expenses broadly unchanged, gives adjusted EBITDA of about $1.8 billion. I then assume that stronger EBITDA lifts operating cash flow from $1.047 billion in the first quarter to about $1.5 billion. The actual figure will also depend on movements in working capital.
The market expects full-year 2026 capital expenditure of about $48.7 billion, or an average of $12.175 billion per quarter. I round that to $12.5 billion. Subtracting capital expenditure from operating cash flow gives free cash flow of approximately negative $11 billion.
Positive adjusted EBITDA and operating cash flow do not mean that SpaceX can fund its expansion internally. Tesla's first-quarter results beat expectations, but the company raised its 2026 capital-expenditure forecast from more than $20 billion to more than $25 billion. Its shares reversed an initial gain of about 4% and closed down 2.4%. Alphabet also beat expectations, but its capital-expenditure forecast was nearly double the previous year's level, and the shares fell 0.5% the next day. The market will accept heavy investment only when the timetable for returns is credible. SpaceX has yet to explain when AI and Starship will cover their investment costs.
IPO proceeds increase cash on the balance sheet, but they are not cash generated by the business. A small revenue beat would not change my view. If operating cash flow fails to improve with revenue while capital expenditure remains high, SpaceX is expanding faster without improving shareholder returns.
3. What Cash Flow Would Justify a $1.5 Trillion Valuation?
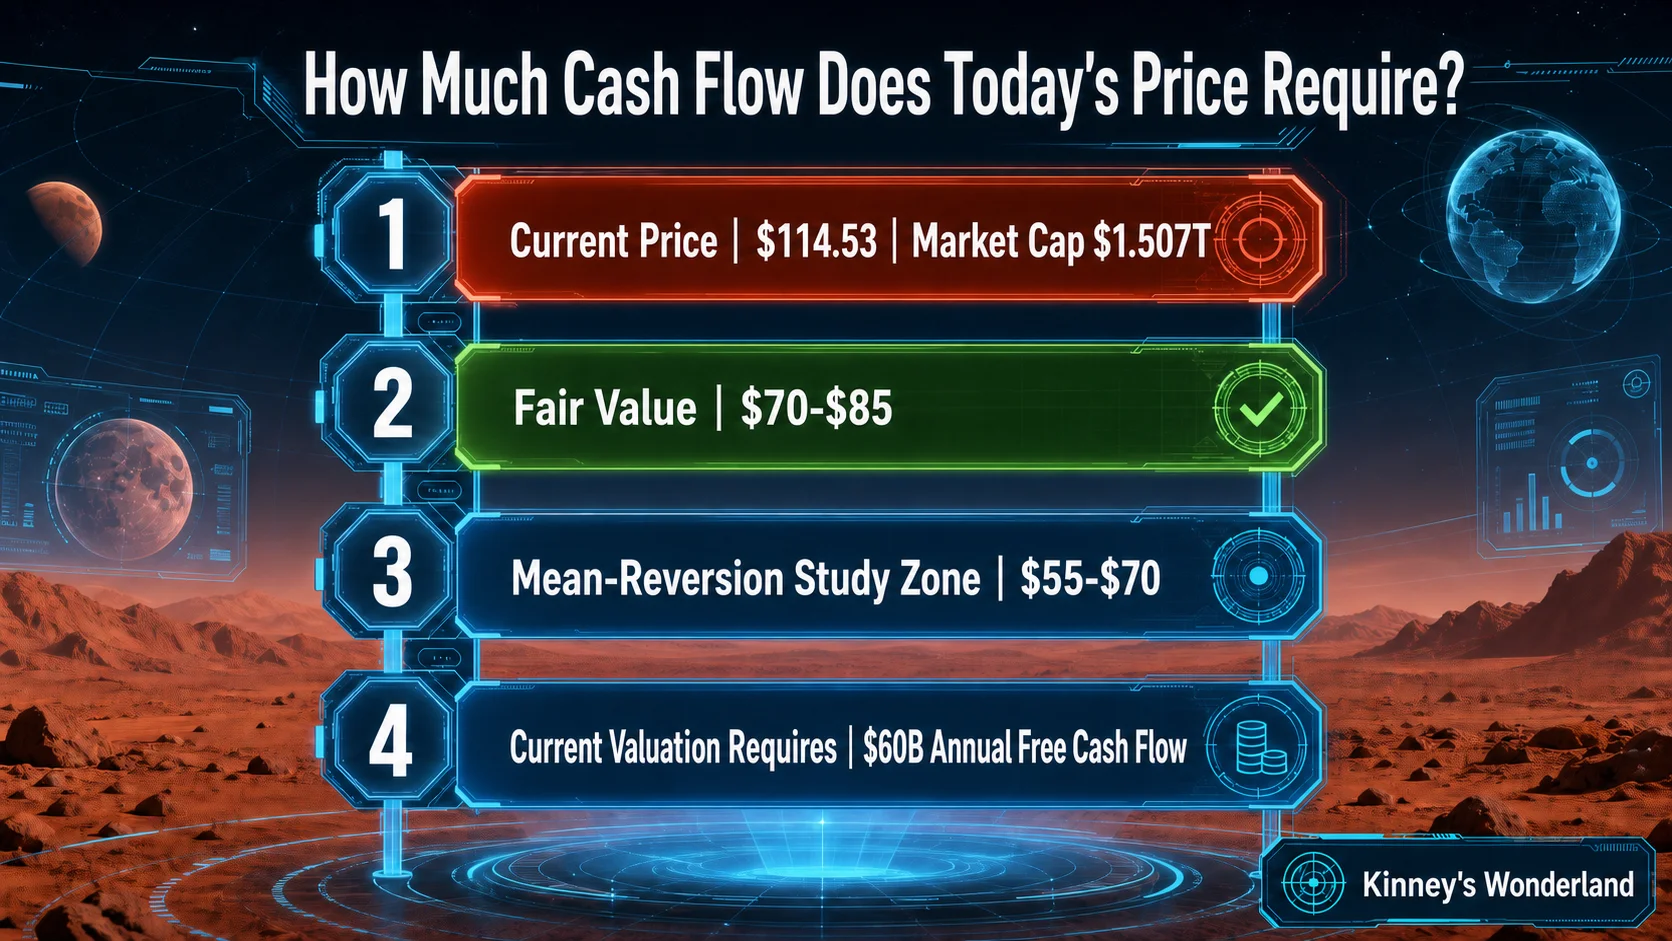
SpaceX has fallen almost 50% from its post-IPO high of $225.64. Yet at about 13.159 billion basic shares outstanding, the current price still implies a market capitalisation of $1.507 trillion. That is 80.7 times 2025 revenue. Even if I annualise my second-quarter revenue forecast, the price-to-sales ratio is still about 55.4 times.
Assume the market eventually values a mature SpaceX at 25 times free cash flow. The current market capitalisation would require about $60 billion of annual free cash flow. At a mature free-cash-flow margin of 25% to 30%, SpaceX would need annual revenue of approximately $201 billion to $241 billion, or seven to nine times my estimate for 2026. Today's price already assumes continued Starlink expansion, successful Starship commercialisation and eventual success in AI. A delay in any one of them would compress the valuation.
Using about 13.159 billion shares and my 2026 revenue estimate of $27 billion to $30 billion, this is how I value the stock:
- Above $100 (market capitalisation above $1.32 trillion): The price already reflects a large amount of growth and profit that has yet to materialise.
- $85 to $100 ($1.12 trillion to $1.32 trillion): Valuation pressure is lower, but the margin of safety remains inadequate.
- $70 to $85 ($921 billion to $1.12 trillion): My fair-value range, with a midpoint of about $78.
- $55 to $70 ($724 billion to $921 billion): A zone for studying an oversold mean-reversion opportunity, but only if the results meet the four minimum conditions below.
- Below $55 (below $724 billion): Investors must first distinguish deep overselling from a broken investment thesis.
Even at $55, the price-to-sales ratio would still be 24 to 27 times. That remains expensive for a growth company with deeply negative free cash flow. I would study a mean-reversion trade between $55 and $70 only if revenue reaches at least $6.5 billion, Connectivity's operating margin stays at or above 35%, operating cash flow reaches at least $1.0 billion and capital expenditure does not exceed $14 billion. The mean-reversion target would be $70 to $85. A clear failure on any one of these conditions would make the decline a fundamental repricing, not merely an oversold move.
4. Good Results Add Buyers; Lock-Up Expiry Adds Sellers
Under the final prospectus, up to 911.5 million shares held by non-affiliates become eligible for sale on 6 August, the second full trading day after the first earnings report. This is a maximum eligible amount, not a forecast that every share will be sold. Even so, it equals about 14 days of the stock's recent 20-day average trading volume and cannot be ignored.
If 10% is sold, that would be about 91.2 million shares, or 1.4 days of average volume. At 25%, it would be 227.9 million shares, worth roughly $26.1 billion and equivalent to 3.5 days of average volume. At 50%, it would equal about seven days of average volume. Trading volume contains both buyers and sellers; it does not mean the market can absorb the same amount of new supply without a change in price.
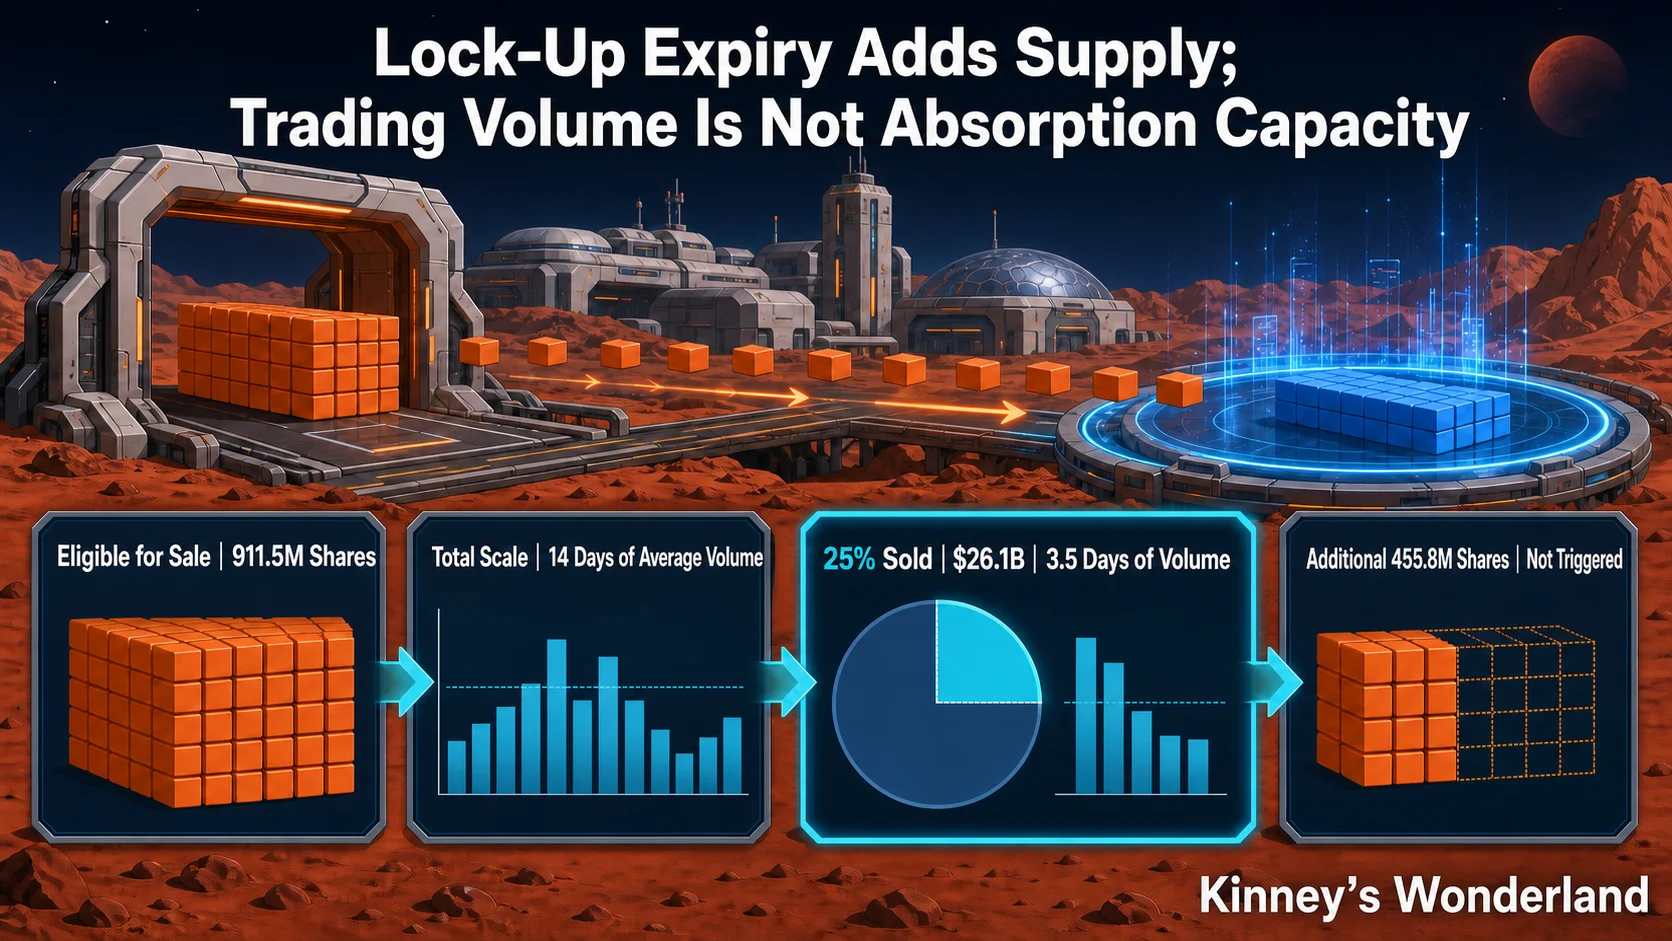
Another 455.8 million shares become eligible only if the closing price reaches at least $175.50 on five of ten specified trading days. That condition has not been met. The real question is whether the buying triggered by earnings can persist for several days after the lock-up expiry. A one-day surge in volume only shows that the market is repricing the stock. If the share price holds its gain afterwards, the market has absorbed the supply.
5. Seven Large IPOs: Four Rose, Three Fell, and the Median First-Day Move Was 10.26%
Among seven large companies reporting their first results after an IPO, four rose and three fell on the first day. Five trading days later, the count was still four up and three down. There was no consistent direction, but volatility expanded sharply: the median absolute first-day move was 10.26%, while volume reached 3.47 times the five-day pre-earnings average.
The first day was not always reliable. Airbnb rose 13.34% on day one but was down 1.01% after five days. Arm fell 5.18% on day one but was up 1.89% after five days. SpaceX's first-day move will therefore show only the market's initial reaction. The real test is whether the move survives from the second through the fifth trading day, after the volume surge and the arrival of potential lock-up selling. None of these companies faced a post-earnings lock-up of the same scale, so their historical returns cannot be applied directly to SpaceX.
6. Three Paths After Lock-Up: Above $120, Range-Bound or Below $104.83
SpaceX has traded publicly for only about seven weeks, so technical analysis can do little more than show whether buyers are absorbing the new supply. The weekly chart still shows lower highs and lower lows. The daily chart has rebounded from $104.83 but remains below the major declining medium-term moving averages. RSI has recovered from around 30 into the low 30s, showing that selling pressure has eased without confirming a reversal. Average true range has fallen from about 16-17 to around 11. Earnings and lock-up expiry will determine whether volatility expands again.
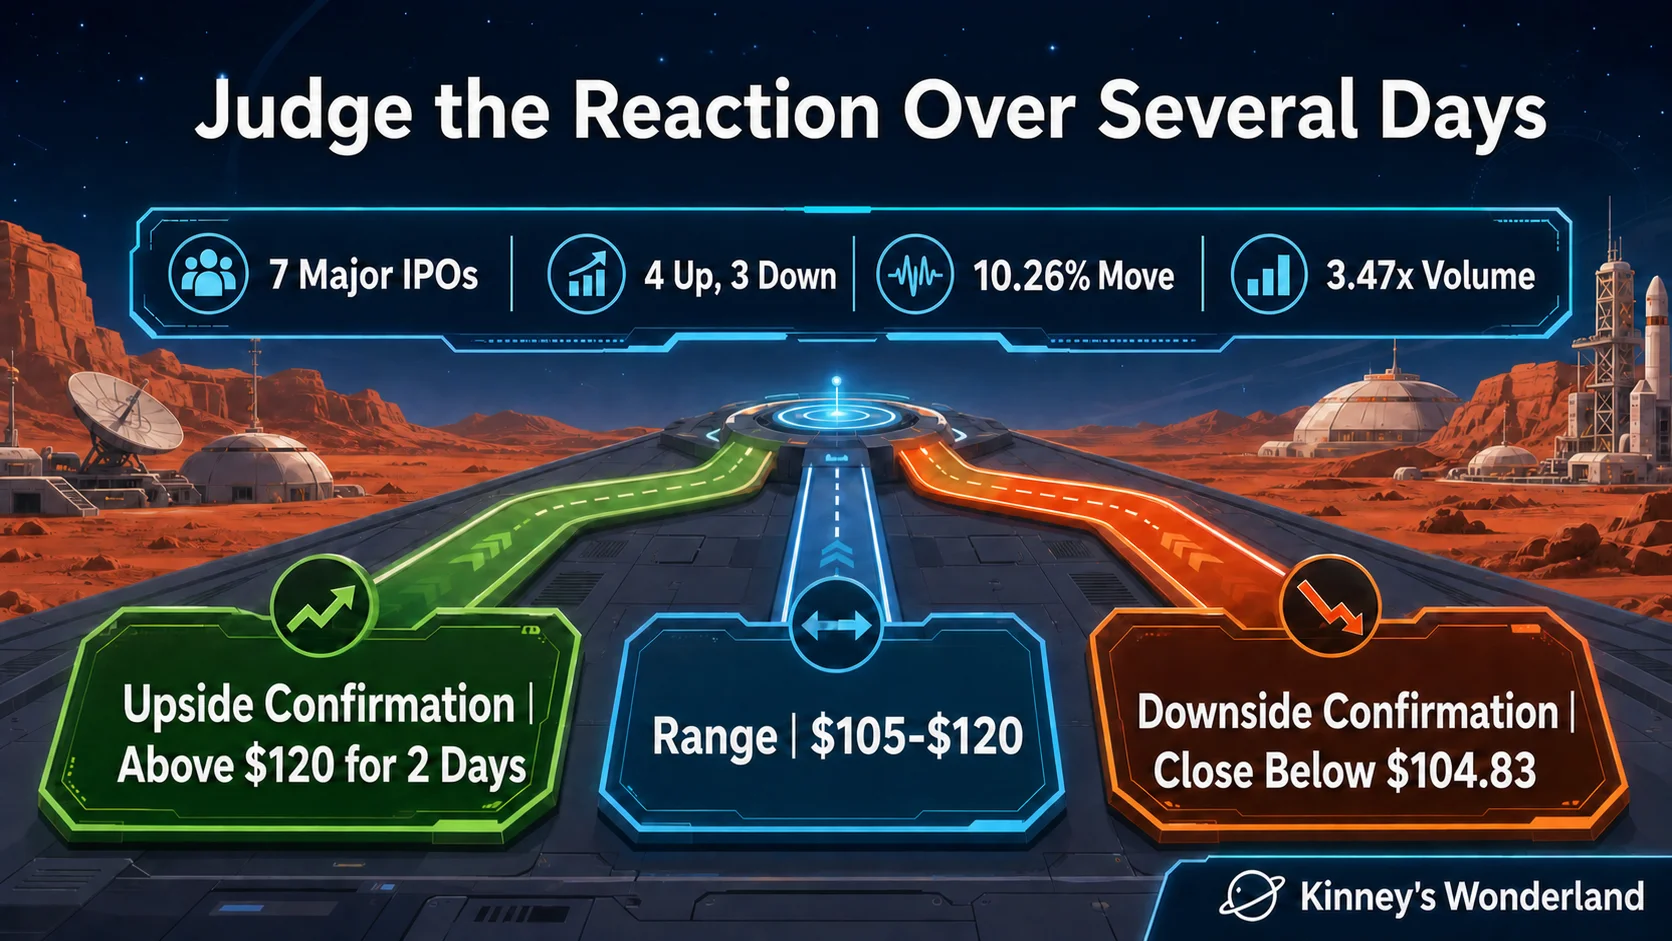
- Upside confirmation: Volume increases, the shares move above $120 and hold that level for two days. The next resistance zone is $125 to $130. The medium-term structure improves only if the stock retakes its $135 IPO price.
- Range-bound: The shares trade between $105 and $120. Earnings-related demand supports the price, while lock-up selling limits the upside.
- Downside confirmation: The stock closes below $104.83. The next threshold is $100. Below that level, there is little trading history and the market must search for a new support area.
If the shares initially rise to $120-$125 after earnings, then quickly lose $120 after the lock-up expiry on sharply higher volume and with a long upper wick, holders are using fresh demand to sell. Technical analysis can confirm whether the market has absorbed the additional supply. It cannot predict the direction in advance.
7. Musk's Premium Can Support the Share Price, but It Cannot Fill a Cash-Flow Gap
Some investors own SPCX because they believe Elon Musk can once again turn the impossible into a commercial reality. Tesla's scale, reusable rockets and Starlink's commercialisation give that belief a basis in Musk's record of execution. If he presents credible and verifiable milestones for AI and Starship, some shareholders will continue to treat negative free cash flow as investment rather than value destruction.
The most optimistic scenario is a Starlink operating margin near 40%, actual lock-up selling below 10%, and continued confidence in Musk's AI and Starship plans. The shares could rebound even if free cash flow remains negative.
Belief alone cannot absorb unlimited selling. If 25% of the eligible shares are sold, their potential value at $114.53 is about $26.1 billion. The Musk premium may reduce shareholders' willingness to sell. It cannot create an equal amount of new capital, and it cannot prove that a $1.5 trillion valuation is justified.
8. What Would Change My View?
A revenue beat alone would not make me more positive. To move from negative to neutral, SpaceX must meet at least four of the first five conditions below, with the fourth condition mandatory, and the sixth price signal must also appear:
- Revenue of at least $7.3 billion, not driven by a one-off contribution from the Space segment.
- A Connectivity operating margin of at least 38%, with average revenue per user at least flat sequentially.
- A clear reduction in the AI loss, with the group's operating loss no greater than $800 million.
- Operating cash flow of at least $2.5 billion, preferably $3.0 billion, with capital expenditure no higher than $11.5 billion.
- Verifiable guidance for second-half profitability, spending, commercialisation milestones and timing.
- During the three to five trading days after lock-up expiry, volume increases while the shares hold $104-$108, then retake $120 and hold it for two days.
If the shares fall to $55-$70, valuation risk would already be lower and I could accept weaker results. Supporting the current price of $114.53 requires the much stronger outcome described above. To turn positive, I would need all five operating conditions to be met and the stock to retake its $135 IPO price.
My forecast is that Starlink continues to grow and revenue lands close to expectations, while the group keeps spending enormous amounts of capital to fund its future. That would prove that SpaceX is a good company. It would not prove that today's price is reasonable. If the results are strong and volume surges but the shares still fall, the market will have given its answer: the immediate problem is valuation and supply, not the dream.
_(Data sources: SpaceX's final prospectus and investor-relations materials, S&P Global Market Intelligence, Yahoo Finance market data, and historical price data for the large IPOs discussed above. Corrections are welcome.)_
_—Kinney's Wonderland_